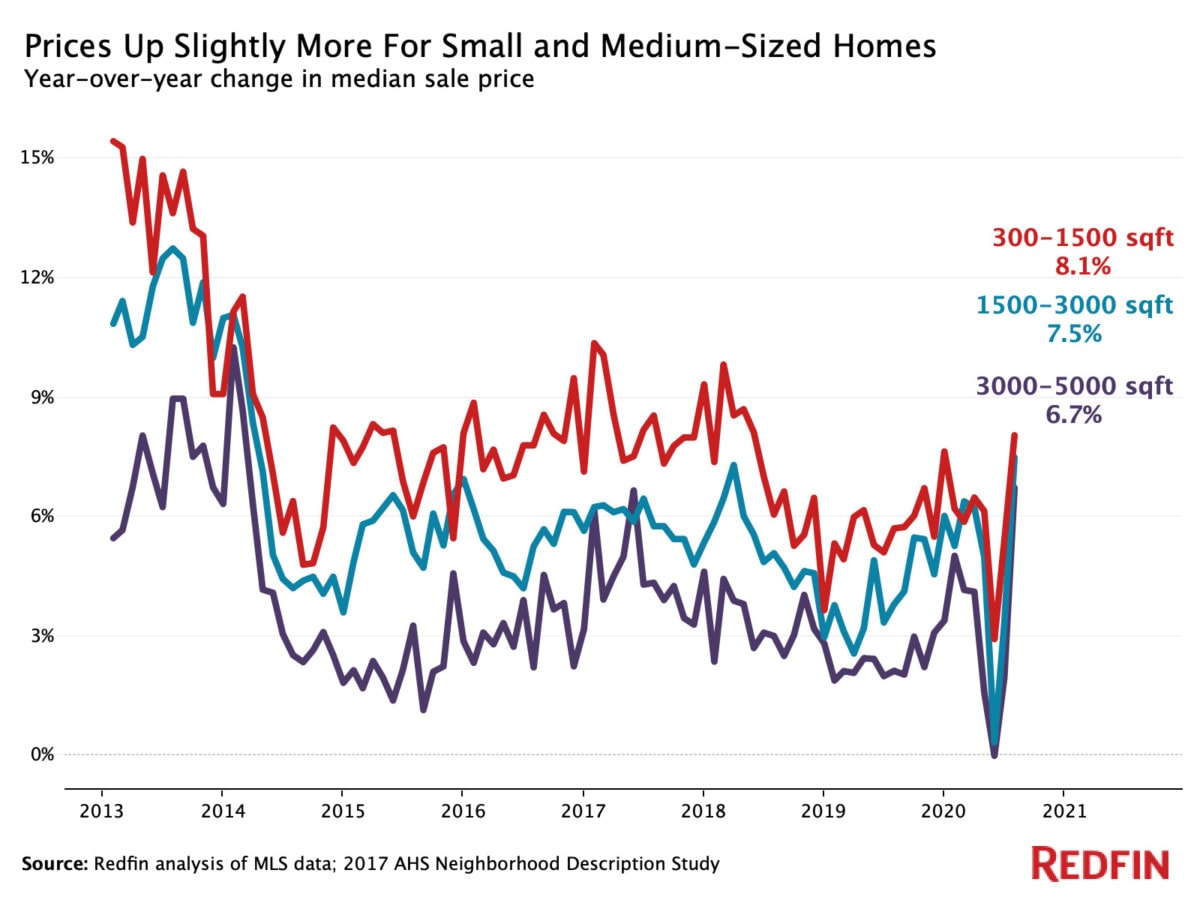
But prices of small homes were up 8.1% year over year in July, compared with 6.7% for large homes, reflecting the continuing importance of affordability for homebuyers.
The typical home that sold in the four weeks ending August 16 was 3.7% larger (1,772 square feet) than the typical home that sold a year earlier. Compare that with 0.4%, the average year-over-year growth rate from 2015 to 2019. Growth in the size of homes people are buying has accelerated since the onset of the coronavirus outbreak. The typical home that went off the market during a similar time period last year (the four weeks ending August 11, 2019) was 1.7% bigger (1,713 square feet) than the year before.
And homebuyers are searching for larger homes. The average minimum square footage of Redfin.com users’ saved searches was 1,864 so far in August, up from 1,794 a year ago and up from 1,803 in January. The size of sought-out homes has been growing over the past five years, up from 1,685 in January 2016.
“People want bigger: Bigger houses, bigger properties,” said Chriss Houghton, a Redfin agent in Vancouver, WA. “That’s what people are asking for, whether their idea of big is a half-acre, one acre or 10 acres. If people are living in a small cookie-cutter home right now, they want a larger house with extra rooms and a dedicated place for an office.”
We delved into July housing market data to analyze whether homebuyer interest in additional space has translated to a hotter housing market for bigger homes. The answer? Yes—but only slightly.
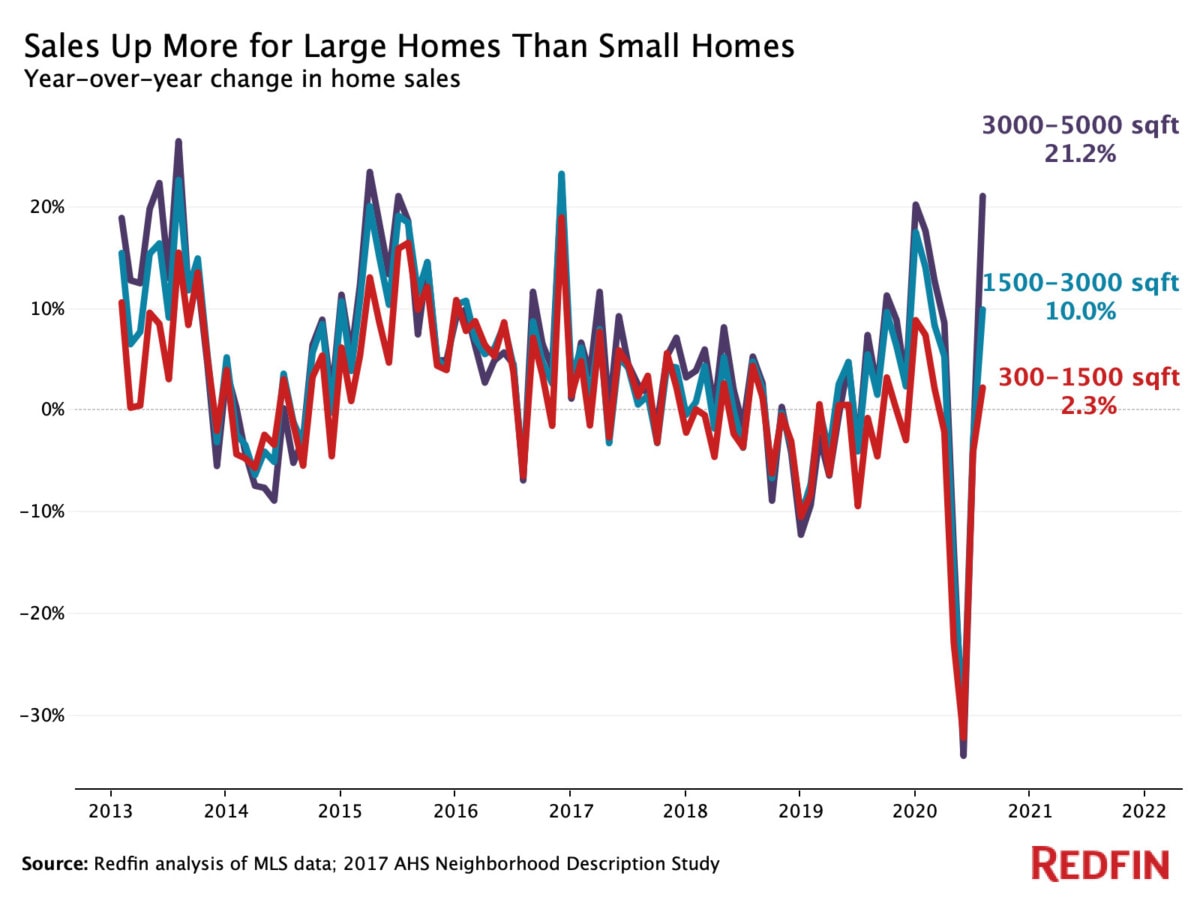
Sales grew nearly 10 times faster for large homes than small homes
Sales were up 21.2% year over year nationwide for large homes in July, compared with 10% for medium-sized homes and 2.3% for small homes. For this analysis, we divided single-family homes across the country into three size tiers: Small (300-1,500 square feet), medium-sized (1,500-3,000 square feet) and large (3,000-5,000 square feet).

The increase in pending sales for large homes was nearly double that of medium-sized homes, with an even bigger gap for small homes
The story is similar for homes that went under contract in July, with large homes experiencing a 16.1% year-over-year increase in pending sales, compared with 9% for medium-sized homes and 2.6% for small homes.
Los Angeles Redfin agent Amy Black said buyers are increasingly willing to trade location for space. “People are realizing it doesn’t make sense to live in the center of Santa Monica in a cramped townhouse when the kids are home and the parents are working from home,” Black said. My clients are more willing to look in neighborhoods they wouldn’t have considered before like Sherman Oaks [about 10 miles away from the center of Los Angeles], where you can have a yard, a pool, and space for the kids to play for the same price as a much smaller home in a place like Santa Monica.”
The coronavirus outbreak has caused homebuyers to want larger homes, with 21% of homebuyers saying the pandemic has caused them to want designated space to work from home and 21% saying it has caused them to want more outdoor or recreational space, according to a Redfin survey of more than 1,000 people who are planning to buy a home within the next 12 months from July 19-21. Additionally, 10% said they now want a bigger home, and 7% said they want a designated space for children to learn from home.
Prices jumped more for rural areas (up 11.3% year over year in July) and suburbs (9.2%) than urban areas (6.7%), which points to a preference for more space. The median square footage of homes that have found a buyer in rural areas and suburbs is about 1,850, versus about 1,500 in urban areas.
But small and medium-sized homes saw their prices increase slightly more than large homes
The price of the typical small home was up 8.1% year over year to $199,900 in July, versus a 7.5% increase to $322,500 for medium-sized homes and a 6.7% increase to $539,000 for large homes.

The bigger price increase for smaller homes is likely due to buyers prioritizing affordability. Seventeen percent of homebuyers said the pandemic has caused them to want a less expensive home, according to the aforementioned survey.
“Most people would prefer a large home over a small home given the choice,” said Redfin chief economist Daryl Fairweather. “That’s true regardless of what’s happening in the world, although spending more time at home due to the pandemic is encouraging some homebuyers to seek out bigger houses with bigger yards. But affordability still reigns, which is why the market for large homes isn’t much hotter than for smaller homes. The lines are drawn economically. The people with steady work-from-home jobs are able to move away from city centers, or even to entirely different parts of the country, and find more space for a similar price. But a lot of people searching for homes are in less advantageous financial situations and can’t afford more space even if they want it.”
“Still, I expect sales of large homes to remain strong,” Fairweather continued. “That’s because builders are responding to the increase in demand for more space. More big new homes will mean buyers won’t have to compete as fiercely, and price growth will likely stabilize as new homes come on the market.”
The typical small home sold 19 days faster than the typical large home
Homes of all sizes sold faster than last year in July, with small and medium-sized homes selling faster than large homes. The typical small home went under contract in 28 days (2 fewer days than last year), versus 34 days (-2) for medium-sized homes and 47 days (-3) for large homes. Just under 39% of small homes went under contract within two weeks (up from 28.9% last year), compared with 34.1% of medium-sized homes (up from 22.8%) and 24.1% of large homes (up from 14.3%). It’s typical for more expensive homes to take longer to sell.
New listings increased nearly 8% for large homes, and declined for smaller homes
New listings of large homes were up 7.6% year over year, while they were down 8.3% for small homes and down 1% for medium-sized homes. Total home supply was down about 25% from last year in July for each category. A lack of new listings has contributed to dwindling supply among small and medium-sized homes. But while there has been an increase in new listings of large homes, they are being snatched off the market in greater numbers, which is why total inventory is down about the same amount for all three categories.
The uptick in new listings of large homes could be partly due to owners of larger, more expensive homes realizing they have the potential to earn a significant amount of money by selling their home.
“Owners of single-family homes are recognizing it’s a good time to capitalize on demand from people who want more room, both inside and outside, to accommodate all the new things they’re doing at home,” said Seattle Redfin agent Jessie Culbert Boucher. The typical large home in Seattle is going off the market within 13 days, faster than any other metro. “Some people have been in their large family homes for decades, they’ve been thinking about selling and see that now is a good time. Others—and these are definitely not the ones who have lost their jobs during the pandemic—are putting their big houses on the market and taking advantage of low mortgage rates to upgrade into even larger, even nicer homes.”
National housing market summary by home size, July 2020 (Single-family homes only)
| 300-1,500 square feet | 1,500-3,000 square feet | 3,000-5,000 square feet | |
| Median sale price | $199,900 | $322,500 | $539,000 |
| Median sale price, YoY | 8.1% | 7.5% | 6.7% |
| Homes sold, YoY | 2.3% | 10% | 21.2% |
| Pending sales, YoY | 2.6% | 9% | 16.1% |
| Home supply, YoY | -25% | -24.3% | -24.4% |
| New listings, YoY | -8.3% | -1% | 7.6% |
| Off market in two weeks | 38.8% | 34.1% | 24.1% |
| Off market in two weeks, YoY, percentage-point change | +9.9 pts. | +11.3 pts. | +9.8 pts. |
| Median days on market | 28 | 34 | 47 |
| Median days on market, YoY | -2 | -2 | -3 |
Metro-level highlights for large (3,000-5,000 square feet) homes
Metro areas included in this section must have had at least 150 large homes sold in July.
- Biggest price increases YoY: Madison, WI (24.1% to $558,500), Charleston, SC (23% to $675,000), and West Palm Beach, FL (16.3% to $785,000)
- Just eight metros experienced year-over-year price declines. Biggest price decreases YoY: Chicago (-6.1% to $540,000), Lake County, IL (-4.6% to $541,823), and North Port, FL (-2.9% to $680,000)
- Biggest increases in homes sold YoY: Sacramento (55%); North Port, FL (51.8%), and Bridgeport, CT (46.6%)
- Just four metros saw year-over-year declines in the number of homes sold: Fort Lauderdale (-13.9%), Spokane, WA (-11.1%), Boston (-5.4%), and New Brunswick, NJ (-0.3%)
- Only two metros had year-over-year supply increases: Fort Collins, CO (9%) and Greeley, CO (2.6%)
- Biggest supply declines YoY: Boise (-66.9%), Provo, UT (-63.9%), and Ogden, UT (-63.2%)
- Fastest markets: Seattle (median 13 days on market before going under contract), Grand Rapids (13), and Spokane (15)
- Biggest portion of homes going off market within two weeks: Seattle (50.7%), Indianapolis (46.9%), and Omaha (46.1%)
- Smallest portion of homes going off market within two weeks: Knoxville (2.4%), Bridgeport, CT (5.2%), and Charlotte (5.4%)
The post The Typical Home Pending Sale Is 3.7% Bigger Than Last Year, Sales of Large Homes Up 21% as People Seek More Space Amid Pandemic appeared first on Redfin | Real Estate Tips for Home Buying, Selling & More.
