Key takeaways for the 4-week period ending August 23:
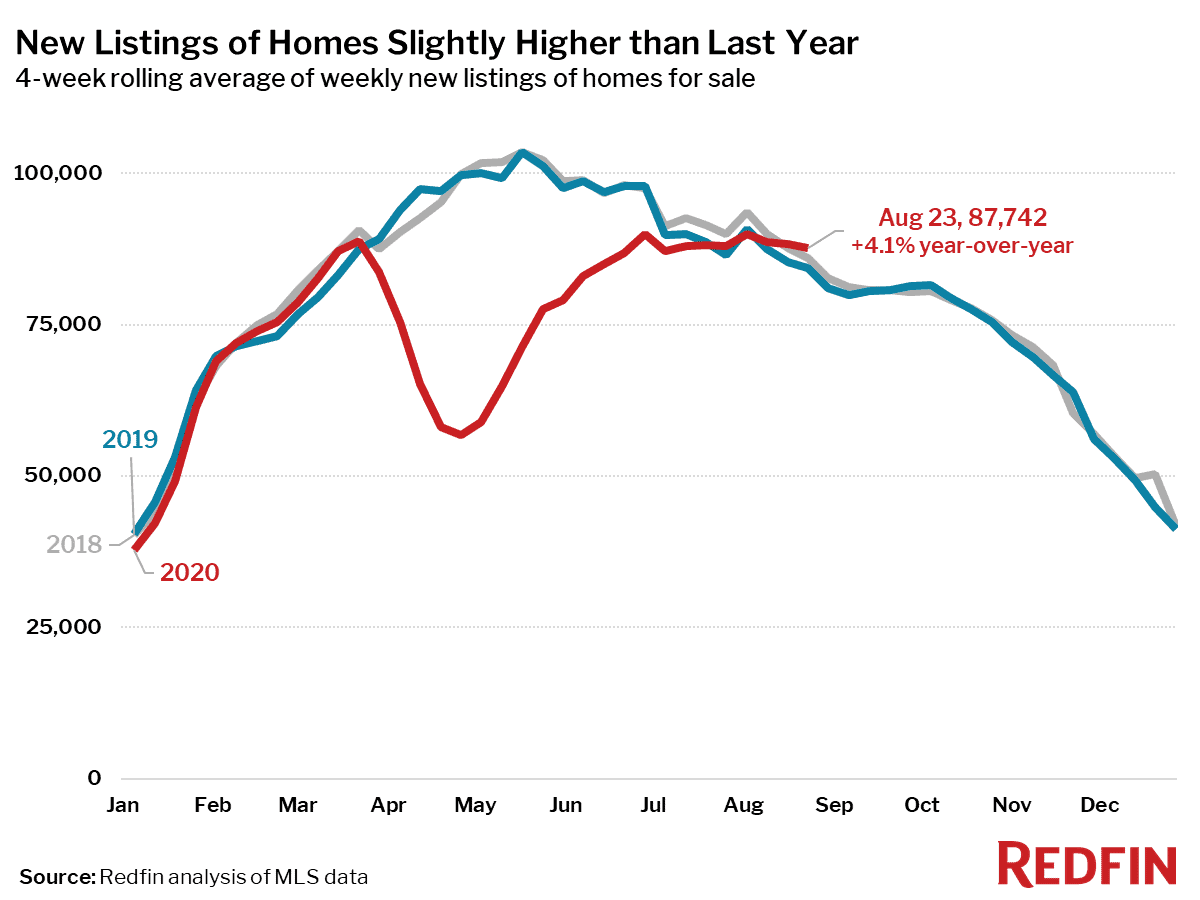
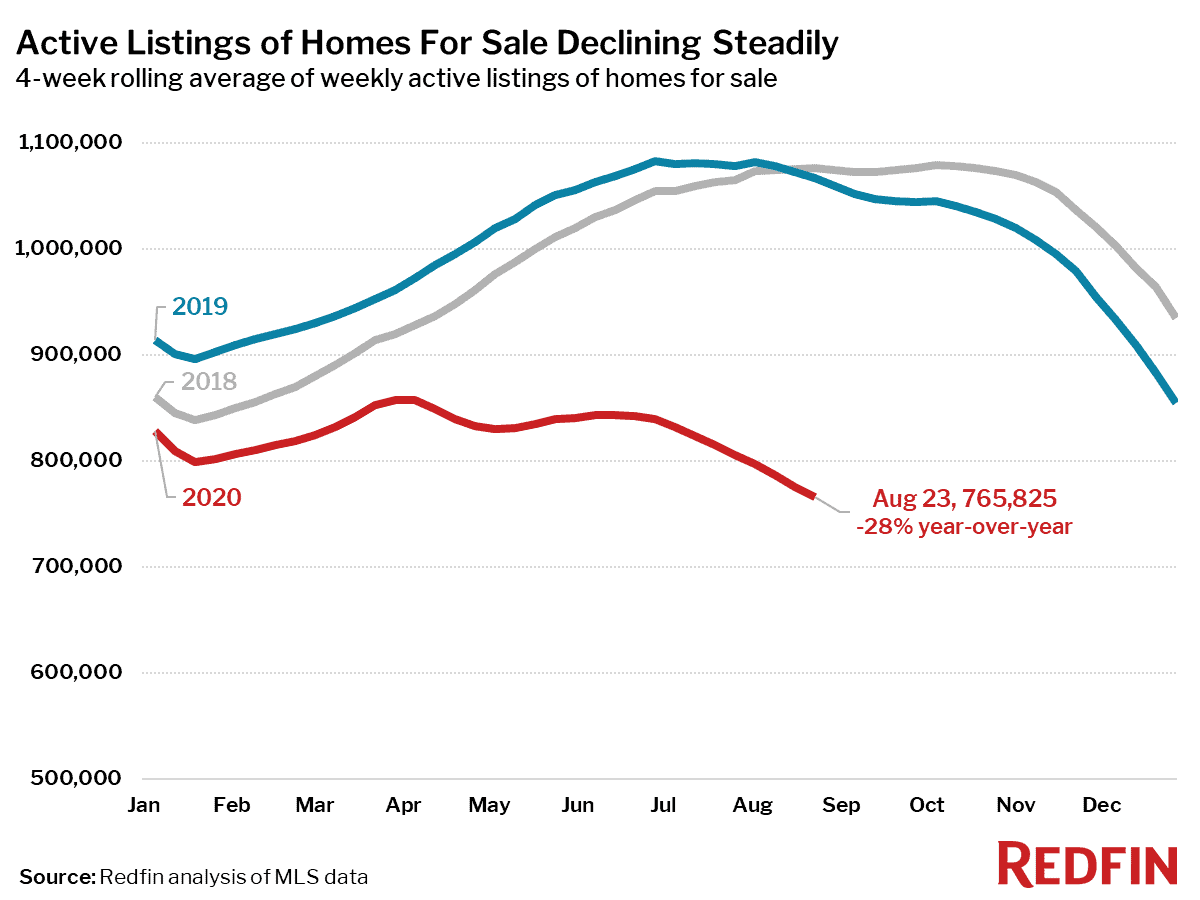
- New listings of homes for sale were up 4% from a year ago—the largest increase since the four-week period ending March 15—but active listings continued to fall, down 28% from 2019.
- Pending home sales rose 20% year over year, even while continuing their near-term seasonal descent. This was the largest year-over-year increase since the four weeks ending October 25, 2015.
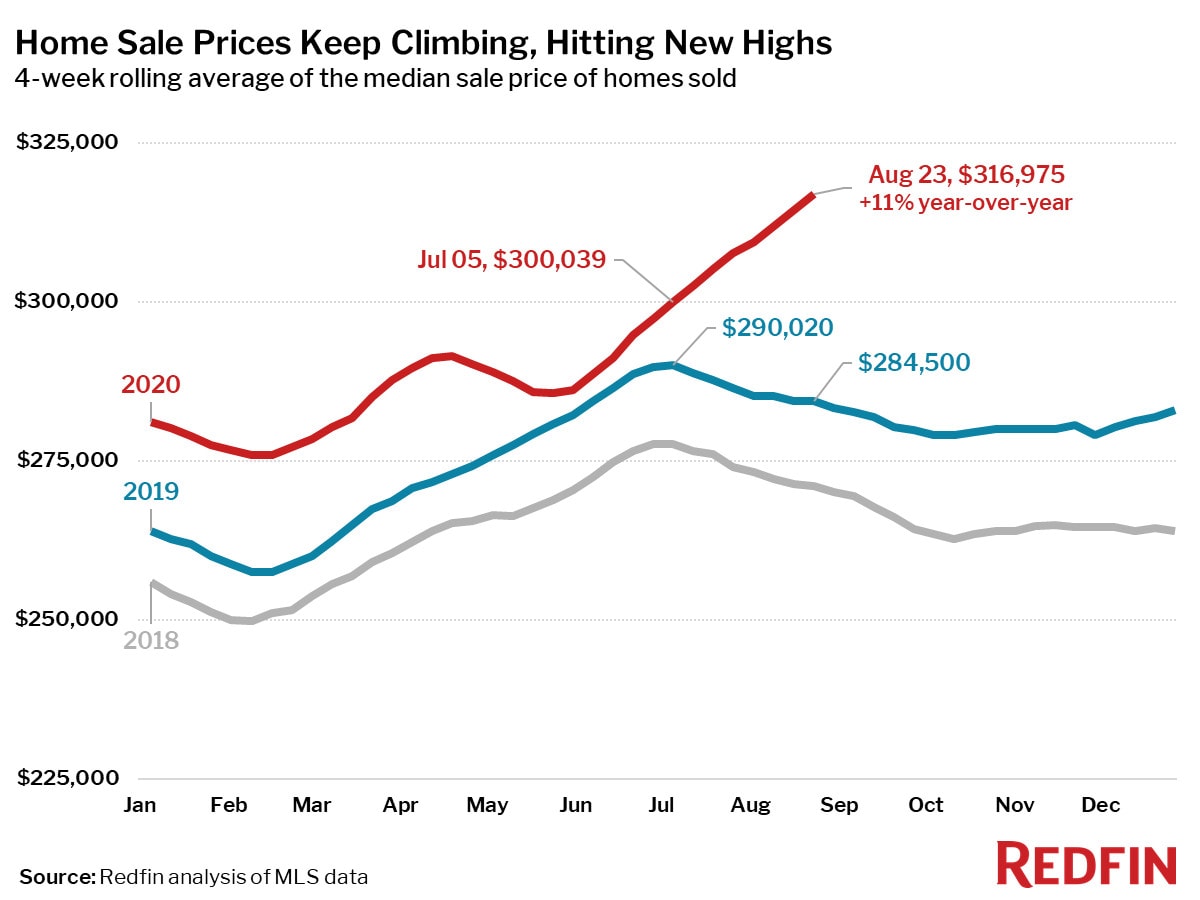
- Median home sale prices increased 11% from 2019 to an all-time high of $316,975.
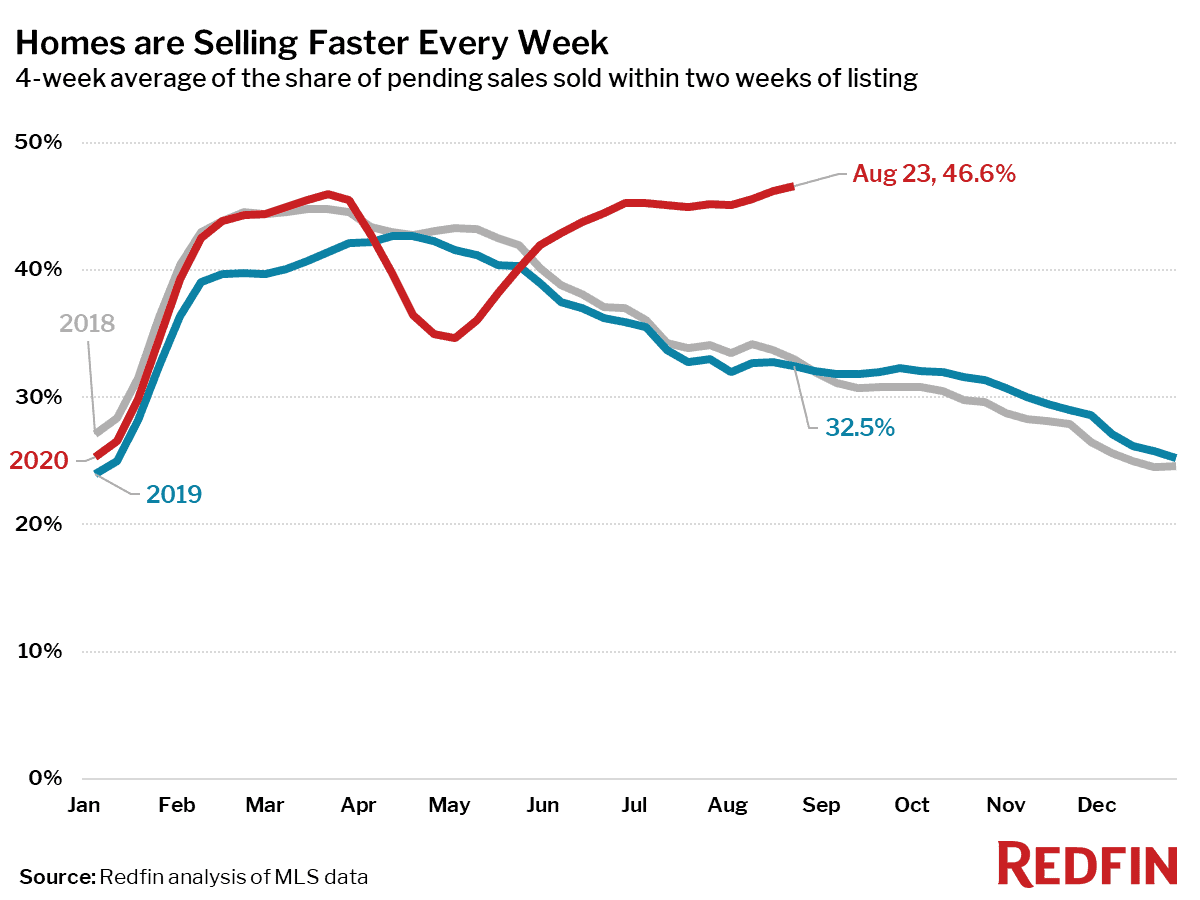
- 46.6% of homes had an accepted offer within the first two weeks on the market, the highest level since at least 2012 (as far back as our data on this measure goes).
New listings posted largest gain since the pandemic began
The U.S. housing market heated up even more, with home prices and measures of competition charging ahead, unfazed by seasonality during the four-week period ending August 23 with strong sales and price growth. The seasonally adjusted Redfin Homebuyer Demand Index was up 29% from pre-pandemic levels in January and February. The biggest change from recent weeks is the number of new listings, which were up 4.1% from a year earlier—the strongest gain since March.
However, the number of homes actively listed for sale during the period was still way down (28%) from the same period a year ago. Active listings have been down 20% or more from a year earlier ever since the four week period ending May 31.
“A lot of the homebuyers I’m working with also have a home they need to sell, but they feel stuck,” said Milwaukee-area Redfin agent Melissa Killham. “Low inventory and a competitive market is making potential sellers afraid to put their house up for sale. They are worried that they won’t be able to buy a home using an offer that’s contingent on the sale of their current home, or that if they sell first, their home will sell before they find something to buy and they’ll have nowhere to live in between.”
Largest annual increase in pending home sales since October 2015
Pending home sales for the four-week period were once again much higher than the same time in 2019, up 20% despite an ongoing seasonal decline over the past few weeks. This was the largest year-over-year increase in pending sales since the four weeks ending October 25, 2015.
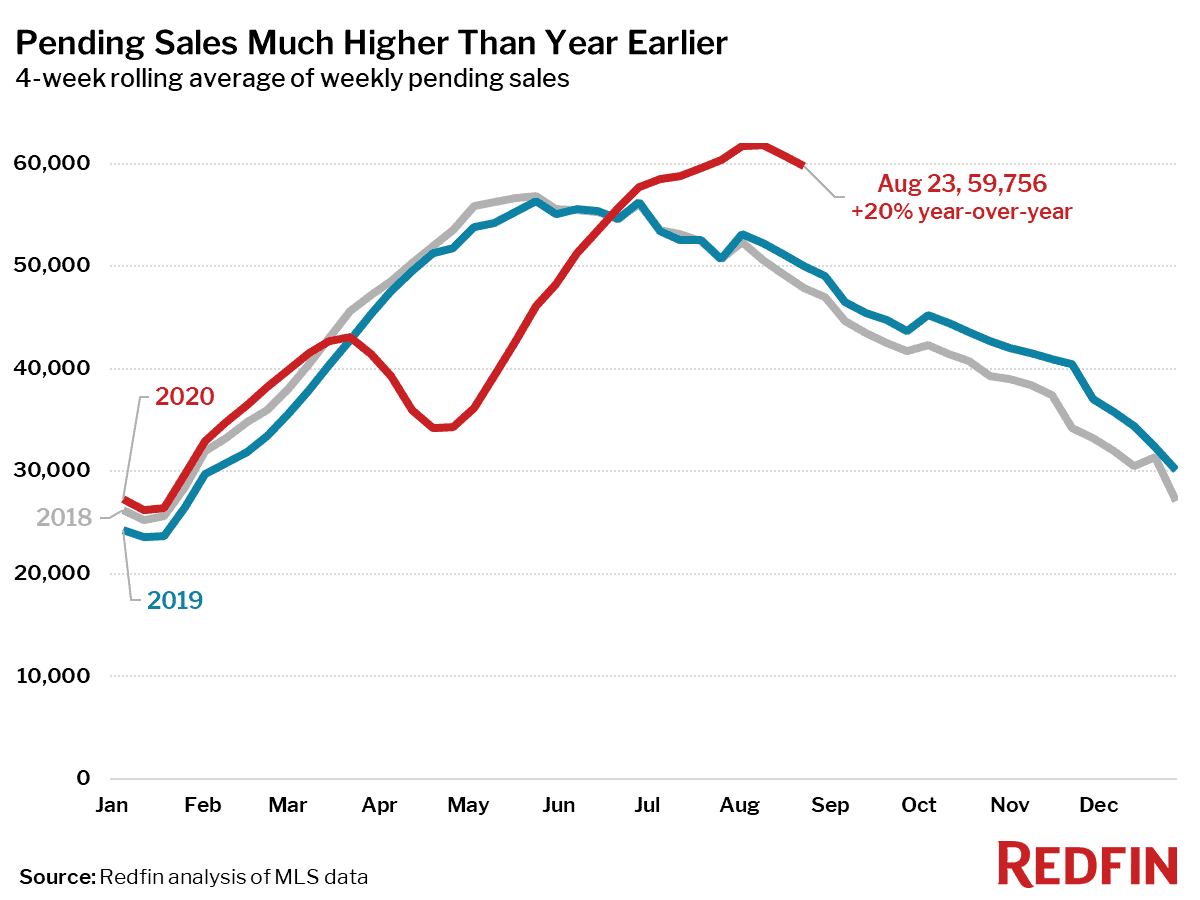
Because growth in homebuying demand (as measured by pending sales, up 20%) continues to dwarf growth in supply (as measured by new listings, up 4%), there seems to be no end in sight to the upward pressure on home prices.
“More new listings are hitting the market than a year ago, but homebuyer demand is outstripping it,” said Baltimore Redfin agent Tim Maller. “There was a brief lull during the height of the coronavirus outbreaks, but now the number of new listings of homes for sale is back to normal. On the flip side, there are a lot more buyers looking right now than we would typically see.”
Prices keep pushing higher and higher
Home price trends since June are best described by Jackie Wilson: “Higher and Higher”. Prices were up 11% from a year earlier for the four-week period ending August 23. In 2018 and 2019, the median home sale price peaked during the four-week period ending in the first week of July, declining 2.4% and 1.9% between that period and mid-August. This year over that same period home prices have increased 5.6%.
The market for homebuyers keeps getting tougher
Buyers in the market today will find homes selling more quickly and closer to list price than ever before. Of homes that went under contract during the four weeks ending August 23, 46.6% found a buyer within two weeks of hitting the market—the highest level we’ve seen since at least 2012 (as far back as our data is available). During the same period last year, 32.5% of homes found a buyer within two weeks.
“This market is really squeezing first-time homebuyers at lower price points pretty hard,” added Maller.
“Many homebuyers are waiving home inspections, appraisals and everything they possibly can to try to win in a bidding war,” continued Killham. “The busy season for real estate seems to be prolonged this year. Usually things have slowed down by now, but homes are still flying off the market, sometimes before you can even see the properties.”
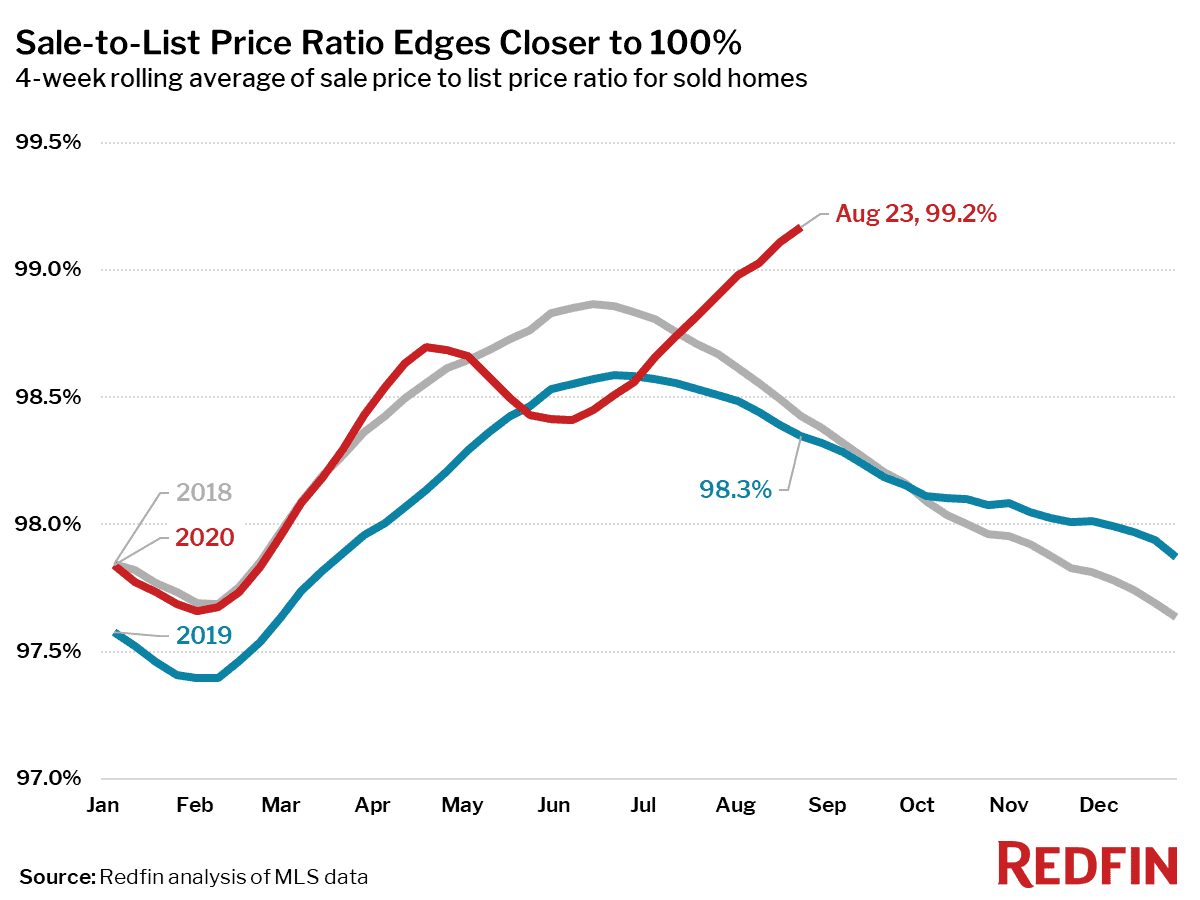
The average sale-to-list price ratio increased again to a new record high of 99.2%–meaning homes are selling closer than ever to their list price–up from 98.3% during the same period last year. Year-over-year changes of nearly a full percentage point in this measure are very rare—last seen in early 2013 as the housing market was finally bouncing off the post-recession bottom.
While this report reflects U.S. market data, Redfin agents describe a similar situation in the major Canadian cities right now, as well. “Some listings are getting 20 to 30 offers on offer night,” said Toronto Redfin agent Sean Starr. “We are having tough conversations with buyers during strategy sessions. We have to explain that just because a home is listed at a certain price doesn’t mean it will sell in that price range. For example, if your budget is $800,000 or $850,000, you’ll potentially need to look at properties listed under $700,000.”
The housing market seems invincible right now
“It seems like nothing can stop the housing market from charging forward with rising prices and increasing sales right now,” said Redfin chief economist Daryl Fairweather. “Uncertainty around the election, ongoing concerns about the pandemic, high unemployment with expanded benefits that have expired… none of that seems to matter to real estate. If there are dark clouds on the horizon right now for the housing market, you really have to squint hard to make them out.”
On Thursday the Fed officially confirmed their strategy that will hold rates low for a long time. This is likely to mean that mortgage rates around 3% are the ‘new normal,’ and will continue to drive the housing market through at least the end of the year.
The post Seemingly Invincible, the Housing Market Posts More Strong Gains—Pending Sales Up 20%, Prices up 11% appeared first on Redfin | Real Estate Tips for Home Buying, Selling & More.
