The housing and mortgage markets have been the rare bright spots in an otherwise fragile economy brought forth by the ongoing COVID-19 pandemic. Mortgage origination volume this year is on track to be the highest in more than 15 years, led by a strong wave of refinances.
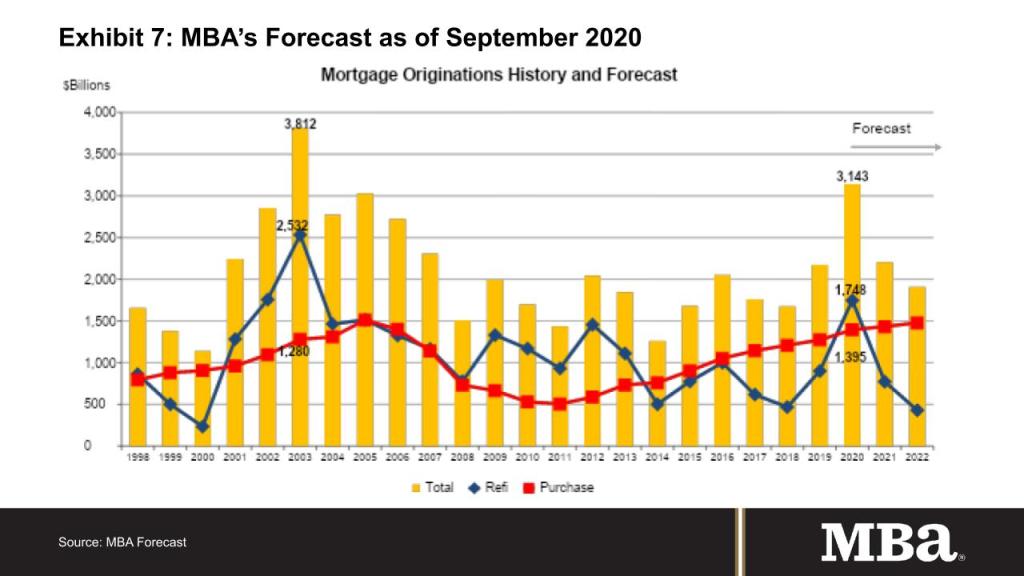
Just how busy have lenders been? 2003 was the last time refinance activity was as high as the $1.75 trillion MBA is forecasting for 2020.
Mortgage rates have reached record lows, driven by the unprecedented economic weakness, as well as the Federal Reserve’s substantial efforts to keep the economy afloat by cutting short-term rates to zero and purchasing more than $1 trillion dollars of mortgage-backed securities. Homeowners are benefitting from lower monthly payments, while lenders are struggling to manage high volumes – all during a time when their employees continue to work remotely, and many temporary origination flexibilities remain in place.
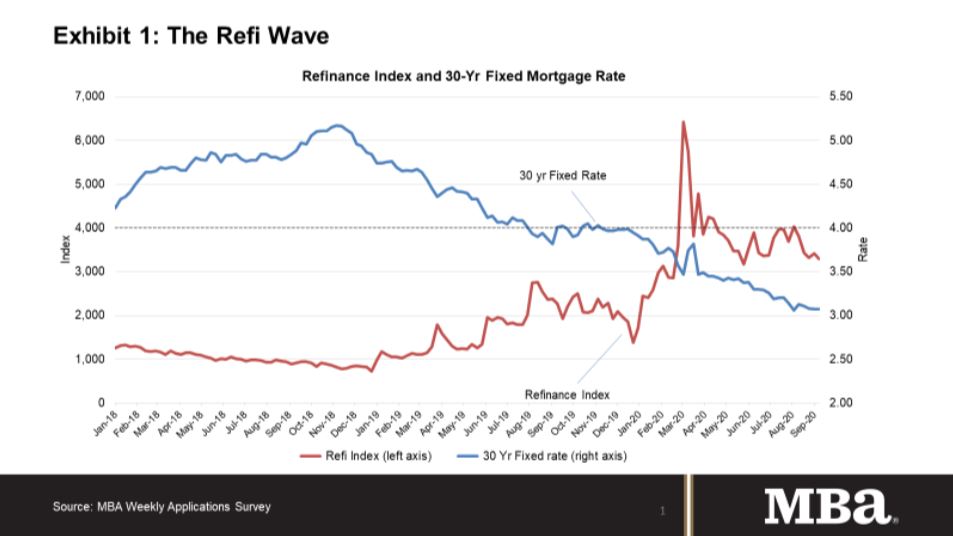
Millions of homeowners still have a sizeable incentive to refinance, given the difference between the rate on their current loan and available market rates. However, recent data from MBA’s Weekly Applications Survey show a robust level of activity (as shown in Exhibit 1), but a volume that is quite sensitive to relatively small changes in rates. Additionally, digging into these data makes one thing clear: the current boom in refinances has not been spread equally across all segments of the market.
While the pandemic caused an abrupt stop in economic activity this spring, resulting in a sharp increase in unemployment and mortgage delinquency rates, this national emergency is different than the Great Financial Crisis (GFC) of more than a decade ago. A central aspect of the GFC was a sharp drop in home prices, which led to an enormous number of households being underwater (owing more on their mortgages than their homes were worth) and constrained from refinancing. The Home Affordable Refinance Program (HARP) certainly helped many households, but it was limited to those with existing loans backed by the government sponsored enterprises Fannie Mae and Freddie Mac.
By contrast, the tale of the housing market in the past several years has been the severe lack of homes for sale on the market, causing home prices to rise at twice the rate of income growth across the country. That is why homeowners, in the aggregate, have gained more than $10 trillion in home equity over the past decade. This time around, homeowners who have been able to keep their jobs through this emergency should be able to qualify for a refinance.
There is little indication at this time that home prices are likely to decline in the near term, as demand has returned to the market since early summer, and housing inventory remains constrained. Additionally, the growth in home equity suggests that even after we are past the peak for rate and term refinances next year, cash-out refinance demand should remain solid.
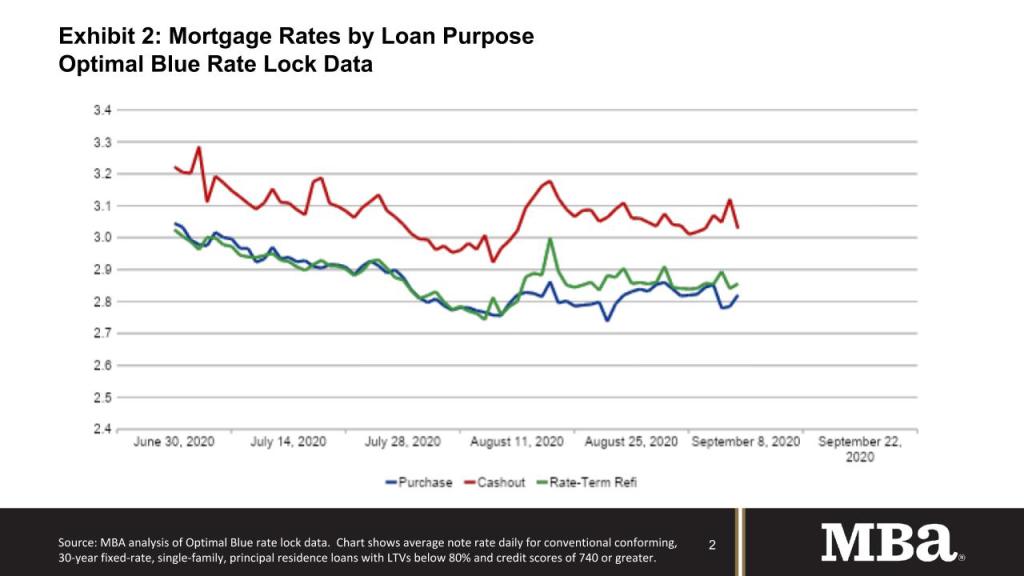
Addressing the elephant in the room, there is certainly also an impact – at least in the conventional conforming market – from the imposition of the GSEs’ adverse market fee on refinances. Even prior to the imposition of this fee, now effective on Dec. 1, 2020, it was not unusual to see lenders quoting higher rates for refinances relative to purchase loans. Recently, some lender websites have been showing rates as much as 50 basis points higher in note rate for rate/term refinance loans compared to purchase loans.
In the broader market, and controlling for more of the relevant risk factors, there is typically a small difference. Until the announcement of the fee, this difference was typically quite small. As shown in Exhibit 2, which utilizes rate lock data from Optimal Blue, this spread widened in mid-August, then narrowed again as the implementation date was delayed. We certainly anticipate that the adverse market fee will be fully priced into refinance rates, likely around an eighth of a point in rate, well in advance of the Dec. 1 date, to allow for the time between rate lock and acquisition by the GSEs.
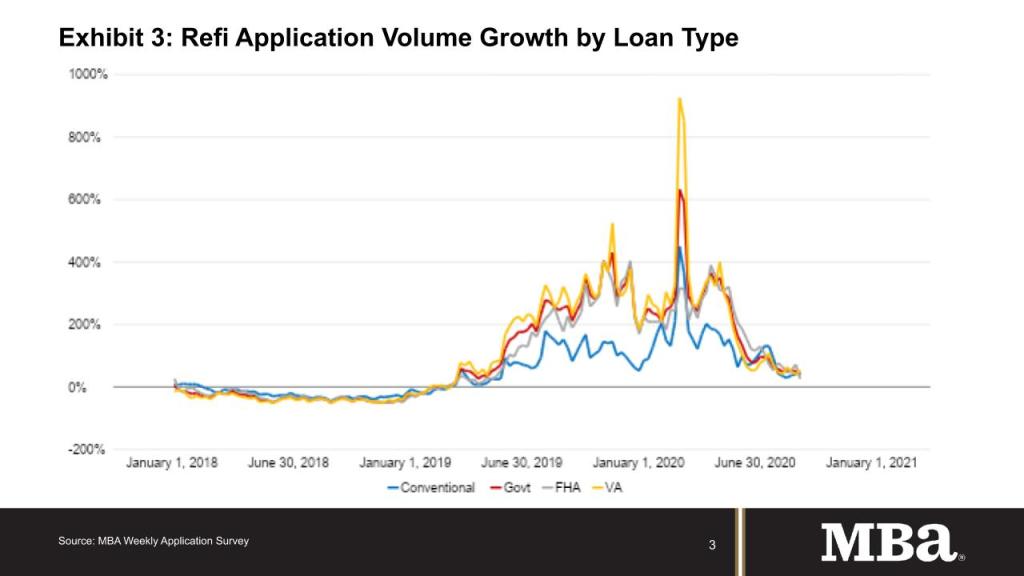
While much of the attention with respect to the refinance wave focuses on the conventional segment, there is certainly also considerable activity in the government space, both for FHA and VA refinances. While roughly three-quarters of the recent total refinance application volume has been conventional loans, the annual growth for refinances per our Weekly Application Survey has actually been running faster for government loans than conventional loans – particularly driven by VA refinance activity, as shown in Exhibit 3.
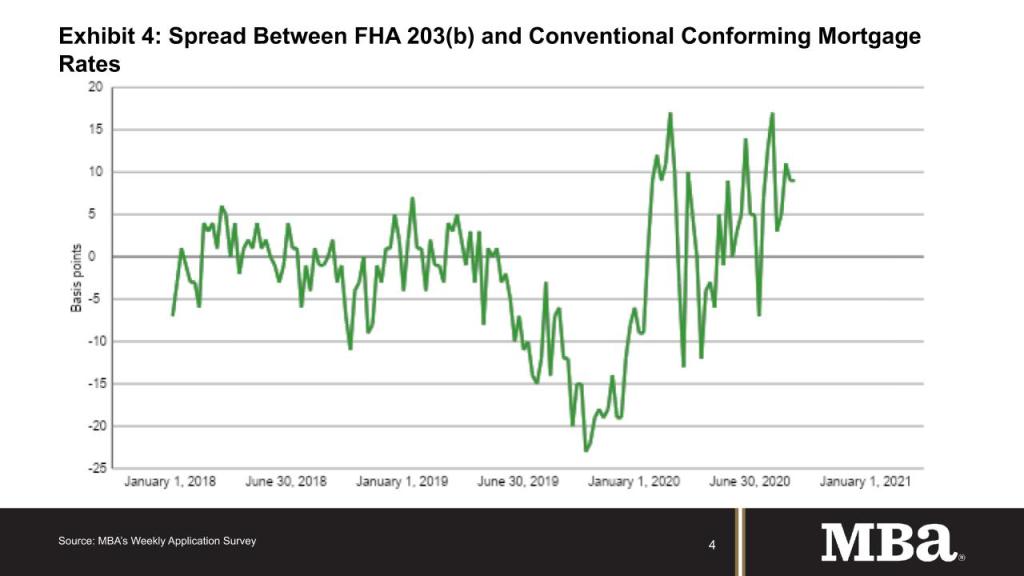
It has been surprising to see in MBA’s data recently that FHA note rates, which typically are below conventional rates, have risen above conforming 30-year rates for much of the pandemic period.
What is driving this? We know that FHA loans have become delinquent at a much higher rate, with the total past due rate above 15% in the second quarter (as reported in MBA’s National Delinquency Survey), and FHA and VA loans have been in forbearance at a much higher rate than GSE loans, per our Weekly Forbearance and Call Volume Survey. Ginnie Mae servicing values have certainly been negatively impacted by the servicing costs anticipated as a result of these higher delinquency rates, and Ginnie Mae MBS values have also been affected by faster and less predictable prepayment speeds.
These factors feed back to the borrower through both more stringent credit requirements and higher rates. In this case, the rates offered are surprisingly even higher than conventional conforming rates, which do not benefit from a full faith and credit backing from the government.
No doubt, these higher FHA rates are both curtailing the extent of FHA refinance volume, and likely also leading to some FHA to conventional refinances, where those are possible. However, the imposition of the GSE adverse market fee likely complicates that transition. Fortunately, the exemption of the GSE affordable housing programs, and very low loan balance mortgages from the fee, could help some of these homeowners benefit from refinancing while rates remain at record lows.
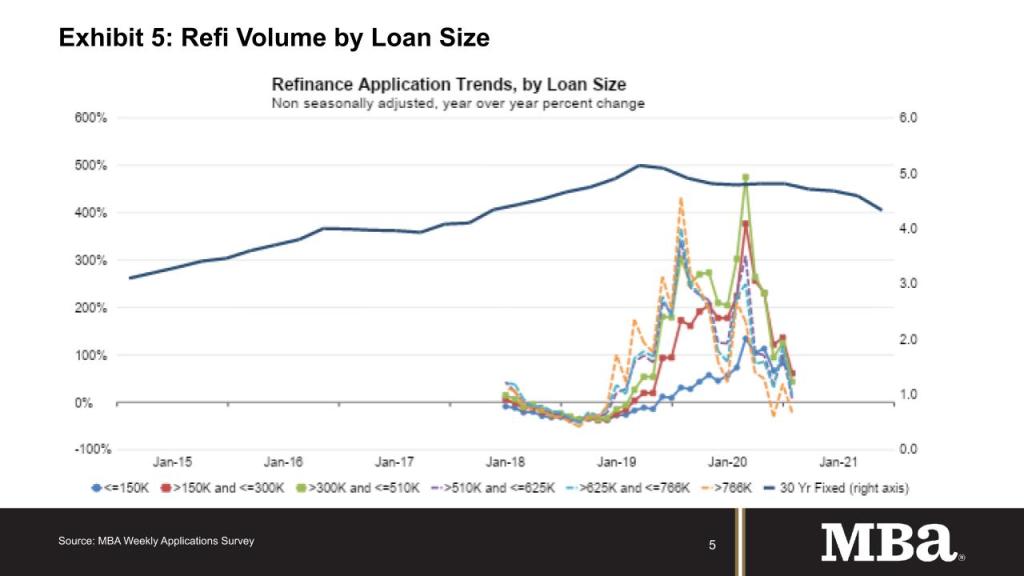
In studying refinance activity by loan size, the fastest growth in refinance volume has been in the core of the conventional conforming market: loan balances between $300,000 and $510,000. Smaller balance loans, in many cases likely FHA loans, are impacted by the factors noted above. It is also interesting to note the relatively weak refinance volume for GSE and non-agency jumbo loans. During the crisis, secondary market spreads on agency jumbos widened due to the relative lack of liquidity of these loans – the result of the restriction that to remain TBA-eligible, no more than 10% of a pool can consist of agency jumbo loans.
Non-agency jumbo loans over the past decade have primarily been held on bank balance sheets, with a limited portion being securitized into private label securities (PLS). During the pandemic, PLS issuance plummeted, and banks have had many competing demands for limited balance sheet space. As a result, credit criteria for jumbos have tightened, and jumbo rates have not fallen nearly to the same extent as conforming rates.
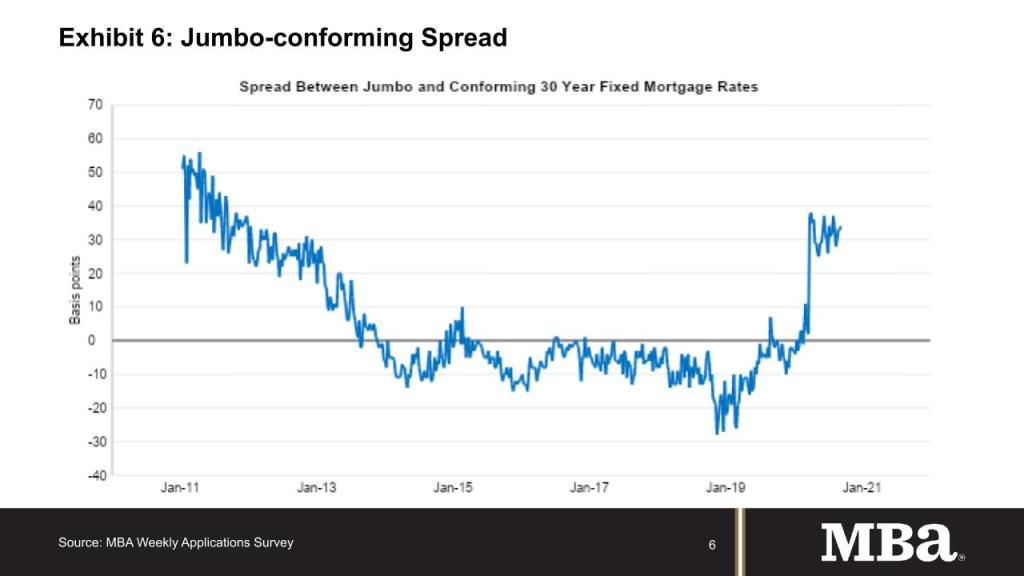
In fact, jumbo rates are once again higher than conforming rates. As shown in Exhibit 6, while the jumbo-conforming spread had been negative for much of the time over the past seven years, beginning this spring, this spread jumped from a small negative to up to a positive 30 basis points.
Typically, prepay speeds on larger loans are much more sensitive than smaller ones for a given change in rates, as the fixed costs of refinancing can be spread over the larger loan balance. The relatively muted refinance response of jumbo loans thus far is likely due to the tighter credit and smaller rate drop, as noted. However, this does indicate that there may be some potential for more jumbo refis as we move into 2021.
MBA is currently forecasting over $3 trillion in mortgage originations volume for this year, with refinances accounting for $1.75 trillion of the total. A recovering economy and historically high levels of U.S. Treasury issuance should put some upward pressure on Treasury and mortgage rates, even as the Fed acts to support the economy through keeping short-term rates at zero and making further asset purchases.
With even a modest increase in mortgage rates, we expect refinance volume will fall off in 2021 – especially in the second half of the year – to $772 billion. As noted above, we do expect the composition of refi activity to shift over the course of the year, as both ends of the spectrum, FHA and jumbo borrowers, begin to see more favorable terms and rates as the economic recovery continues.
2020 has been a banner year for mortgage originators and the millions of households who have benefitted from record-low rates through refinancing. The industry will enjoy this boom for a while longer, but our expectation is that the refi wave is cresting, just as the air turns crisper and summer officially comes to an end.
The post [PULSE] The 2020 refi wave: Where activity is strongest, where it’s not, and what’s ahead appeared first on HousingWire.
