Low mortgage rates have attracted more buyers to the market—especially first-timers—amid a supply shortage that’s showing no signs of letting up. Meanwhile, prices of expensive homes have risen just 2%.
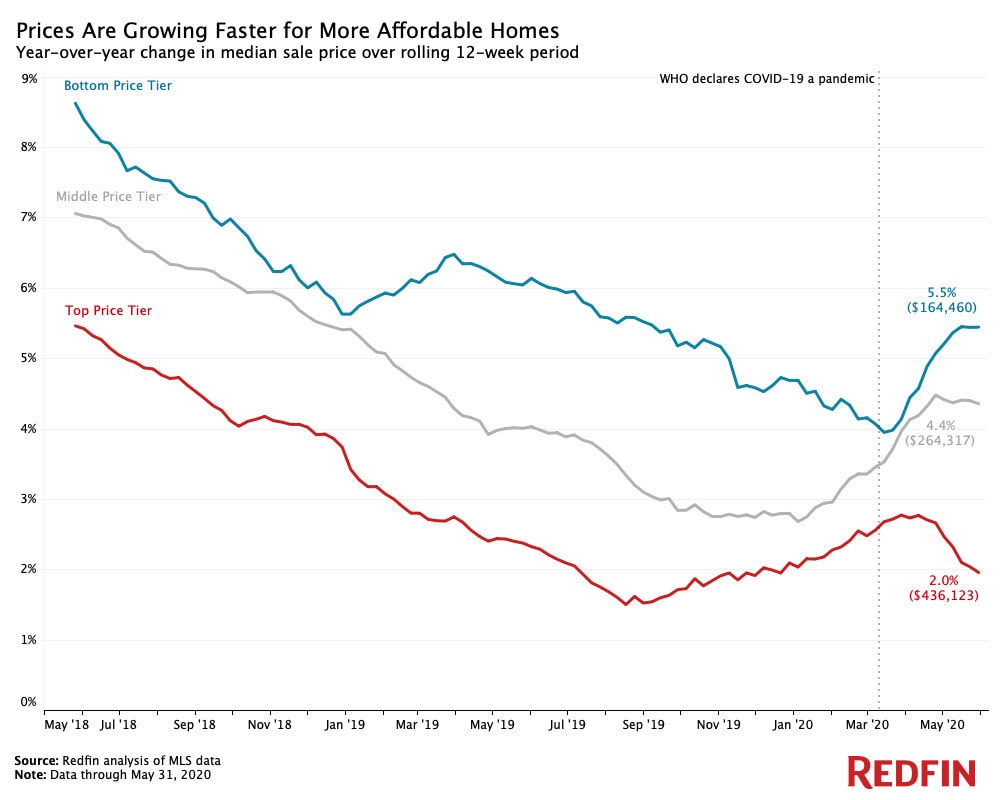
Prices of the most affordable third of homes in the U.S. climbed 5.5% year over year during the 12 weeks ending May 31, while prices of the most expensive third of homes increased just 2%.

This is according to an analysis that divided all U.S. residential properties into five tiers based on Redfin Estimates of the homes’ market values as of early June. This report focuses on the “bottom” or “affordable” tier, i.e. homes estimated to be in the 6th-35th percentile for value, and on the “top” or “expensive” tier, which represents homes estimated to be in the 66th-95th percentile for value. For the purposes of this report, we did not look at the very top and bottom 5% of the market. We will report separately on the top 5% of the market, which we consider to be the “luxury” market.
Redfin agents report that housing demand and competition—especially for affordable homes—are on the rise, driving up prices in this segment of the market even as the coronavirus pandemic continues to take a toll on the U.S. economy. As shown in the chart above, price growth began accelerating for affordable homes and decelerating for expensive homes shortly after the World Health Organization declared COVID-19 a pandemic on March 11. By May 31, the gap between the top and bottom price tiers’ growth rates had widened to 3.5 percentage points. This represents a reversal of the trend we observed leading up to the pandemic, when the price-growth gap had narrowed to as little as 1.26 percentage points during the 12-week period ending March 22.
“Spending so much time at home during quarantine has made a lot of people realize that it might be time to stop renting a cramped apartment in the city and time to start owning their first single-family home,” said Pam Henderson, a Redfin agent in Dallas. “With mortgage rates at record lows and remote work on the rise, some renters are having an epiphany: They could buy a lower-priced home in the suburbs for close to what they’re paying in rent.”
In Newark, NJ, the most affordable third of homes saw prices surge 14.7% year over year to a median of $211,281 during the 12 weeks ending May 31—the largest increase out of the 50 most populous U.S. metropolitan areas. Philadelphia and Detroit followed closely, with prices jumping 13.6% and 13.3%, respectively. The only metros that saw prices in the most affordable bucket decline were San Jose (-2.4% to $777,500) and San Francisco (-2.1% to $952,125)—markets where the “affordable” tier is already so expensive that prices don’t have much room to grow.
Tony Orlando, a Redfin agent in Detroit, is working with a young couple who recently lost a bidding war after their offer for a home’s full asking price turned out to be the lowest of three bids. The first-time homebuyers, who have a budget of $170,000-$230,000, have now lost out on a total of seven houses.
Affordable-Home Supply Continues to Shrink
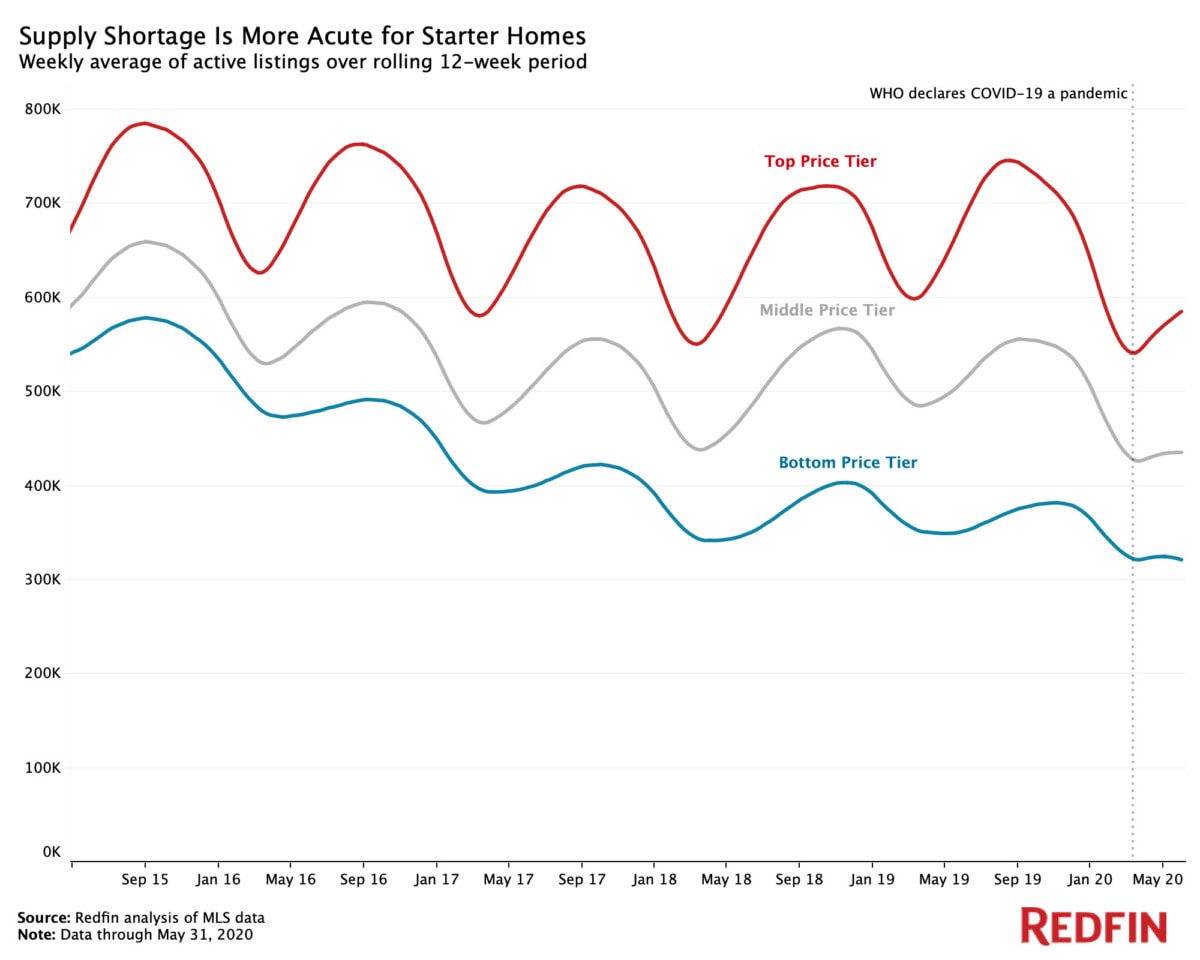
The jump in prices of affordable homes is tied to a shortage in the number of affordable homes on the market—an issue that has plagued house hunters since 2012 and is showing no signs of letting up.

As shown in the chart above, the gap between the supply of affordable and expensive homes widened further as the coronavirus pandemic worsened. Nationwide, there was a weekly average of about 322,000 homes for sale in the bottom price tier during the 12 weeks ending May 31, down from 332,000 in February. By comparison, there was a weekly average of 586,000 homes on the market in the top price tier, up from 556,000 three months earlier—in line with expected seasonal growth.
During any economic downturn, buyers tend to flock to more affordable homes, reducing inventory and driving up prices in that segment of the market. Today, this trend is being intensified by low mortgage rates, which are attracting a rising share of first-time homebuyers, who tend to purchase homes on the less expensive end of the spectrum, said Redfin lead economist Taylor Marr.
“The severe shortage of affordable homes that we’ve been grappling with for years is now being exacerbated by an increase in the number of buyers who are in search of lower-cost houses,” Marr said. “Many Americans—especially millennials—were already toying with the idea of buying their first house before the pandemic. Now they’re actually taking the plunge because mortgage rates are so low and it’s less attractive to live in a small apartment right next to the office.”
Marr continued: “Prices will likely continue to grow faster in the more affordable segment of the market for at least the next few years given this lack of supply. Fortunately, mortgage payments are actually lower now than they were a year ago, despite the growth in home prices, because mortgage rates have dropped so much; the median monthly payment on a home listed in May fell to $1,170 from $1,225 during the same period the prior year, despite an $18,000 rise in asking prices.”
Demand Ebbs for Pricey Homes
In nearly every metro we analyzed, the top price tier grew at a slower rate than the bottom price tier during the 12 weeks ending May 31. Three metros even saw prices in the top tier decline. These markets were Dallas, Houston and Chicago, where prices in this segment dropped 2%, 1% and 0.4%, respectively.
Demand for expensive homes has dwindled since the pandemic started, according to Henderson, the agent in Dallas.
“I haven’t had a client buy above $400,000 in a while,” Henderson said. “Buyers who are still searching in the high end of the market seem to be a bit more patient. They can afford to wait for their dream home, whereas people with tighter budgets want to buy now in order to take advantage of record-low mortgage rates.”
The relatively slow price growth at the high end of the market may also be tied to the fact that people are now purchasing less expensive high-end homes, according to Marr. For example, a high-end buyer may now be in the market for an $800,000 home, whereas before the pandemic, their budget may have been closer to $1 million.
Another factor contributing to the slowdown at the high end of the market is the ongoing credit crunch. Many buyers have found it difficult to secure jumbo loans, which are regularly used for purchases of pricey homes, as banks have backed away from this type of credit during the pandemic.
Metro Breakdown
Here’s a metro-level breakdown showing the year-over-year change in median sale prices for all three segments of the market during the 12 weeks ending May 31:
| Metro Area | Bottom Price Tier: Change in Median Sale Price Y/y | Bottom Price Tier: Median Sale Price | Top Price Tier: Change in Median Sale Price Y/y | Top Price Tier: Median Sale Price |
|---|---|---|---|---|
| National – U.S.A. | 5.4% | $164,460 | 2.0% | $436,123 |
| Anaheim, CA | 3.3% | $509,521 | 3.6% | $780,250 |
| Atlanta, GA | 8.4% | $165,904 | 3.0% | $416,357 |
| Austin, TX | 5.9% | $231,573 | 5.1% | $484,280 |
| Baltimore, MD | 3.5% | $153,617 | 3.0% | $446,206 |
| Boston, MA | 7.8% | $344,002 | 5.5% | $638,438 |
| Charlotte, NC | 9.2% | $157,525 | 4.6% | $400,815 |
| Chicago, IL | 1.4% | $149,875 | -0.4% | $427,229 |
| Cincinnati, OH | 8.1% | $134,513 | 8.7% | $345,081 |
| Cleveland, OH | 7.9% | $113,671 | 5.3% | $280,945 |
| Columbus, OH | 10.7% | $145,371 | 2.5% | $381,064 |
| Dallas, TX | 2.3% | $175,642 | -2.0% | $420,399 |
| Denver, CO | 2.6% | $309,396 | 2.2% | $526,931 |
| Detroit, MI | 13.3% | $119,509 | 8.0% | $243,163 |
| Fort Lauderdale, FL | 3.3% | $136,875 | 3.0% | $437,121 |
| Fort Worth, TX | 2.4% | $169,758 | 0.8% | $371,794 |
| Houston, TX | 4.0% | $164,711 | -1.0% | $378,123 |
| Indianapolis, IN | 8.5% | $139,437 | 5.5% | $326,890 |
| Jacksonville, FL | 8.0% | $155,513 | 1.5% | $388,870 |
| Las Vegas, NV | 2.5% | $185,075 | 1.7% | $412,208 |
| Los Angeles, CA | 4.6% | $450,038 | 4.4% | $709,854 |
| Miami, FL | 5.1% | $182,554 | 2.6% | $462,750 |
| Milwaukee, WI | 8.9% | $144,350 | 6.3% | $381,605 |
| Minneapolis, MN | 4.6% | $191,730 | 1.6% | $424,092 |
| Montgomery County, PA | 7.4% | $197,013 | 3.9% | $477,483 |
| Nashville, TN | 7.4% | $194,204 | 5.1% | $453,130 |
| Nassau County, NY | 11.3% | $329,658 | 7.9% | $559,250 |
| New Brunswick, NJ | 9.9% | $193,800 | 6.7% | $508,567 |
| Newark, NJ | 14.7% | $211,281 | 8.9% | $528,991 |
| Oakland, CA | 1.0% | $523,667 | 4.5% | $774,875 |
| Oklahoma City, OK | 7.9% | $141,413 | 2.2% | $266,606 |
| Orlando, FL | 6.7% | $166,542 | 2.0% | $382,526 |
| Philadelphia, PA | 13.6% | $124,195 | 9.7% | $395,448 |
| Phoenix, AZ | 8.4% | $203,865 | 5.6% | $437,003 |
| Pittsburgh, PA | 6.3% | $116,788 | 2.7% | $311,025 |
| Portland, OR | 6.0% | $320,762 | 2.3% | $507,637 |
| Providence, RI | 8.6% | $205,608 | 6.4% | $440,737 |
| Riverside, CA | 5.1% | $254,854 | 4.8% | $487,108 |
| Sacramento, CA | 7.3% | $311,792 | 2.3% | $522,875 |
| San Antonio, TX | 5.3% | $160,854 | 4.2% | $365,151 |
| San Diego, CA | 3.6% | $437,604 | 3.9% | $668,422 |
| San Francisco, CA | -2.1% | $952,125 | 0.8% | $1,786,958 |
| San Jose, CA | -2.4% | $777,500 | 16.9% | $1,150,167 |
| Seattle, WA | 6.4% | $404,569 | 2.5% | $681,063 |
| St. Louis, MO | 4.5% | $121,521 | 5.0% | $328,138 |
| Tampa, FL | 6.7% | $149,579 | 4.1% | $392,720 |
| Virginia Beach, VA | 5.9% | $158,571 | 6.6% | $393,033 |
| Warren, MI | 5.9% | $143,192 | 1.7% | $382,756 |
| Washington, D.C. | 4.6% | $251,656 | 3.4% | $578,755 |
| West Palm Beach, FL | 3.2% | $142,586 | 3.2% | $464,979 |
Methodology
We divided all U.S. residential properties into five tiers based on Redfin Estimates of the homes’ market values as of early June. After excluding the top and bottom 5% of homes, the “bottom” tier represents more affordable homes, or homes estimated to be in the 6th-35th percentile. The “middle” tier represents homes estimated to be in the 36th-65th percentile. The “top” tier represents more expensive homes, or homes estimated to be in the 66th-95th percentile. For the purposes of this analysis, we removed homes in the very top and very bottom 5% of the market by home value to focus on the main segment of the market that represents the types of homes typically being listed and sold by individuals, and to avoid reporting on outliers.
The post Prices of Affordable Homes Have Jumped 5.5% During the Pandemic appeared first on Redfin | Real Estate Tips for Home Buying, Selling & More.
