As states start to relax stay-at-home restrictions amid the coronavirus pandemic, more Americans are putting their homes up for sale—and setting higher expectations for what their houses are worth. But supply has yet to catch up to homebuying demand, which has now eclipsed pre-pandemic levels.
Here are seven charts that illustrate the latest developments in the housing market as COVID-19 continues to transform residential real estate as we know it.
More Sellers Are Listing Their Homes
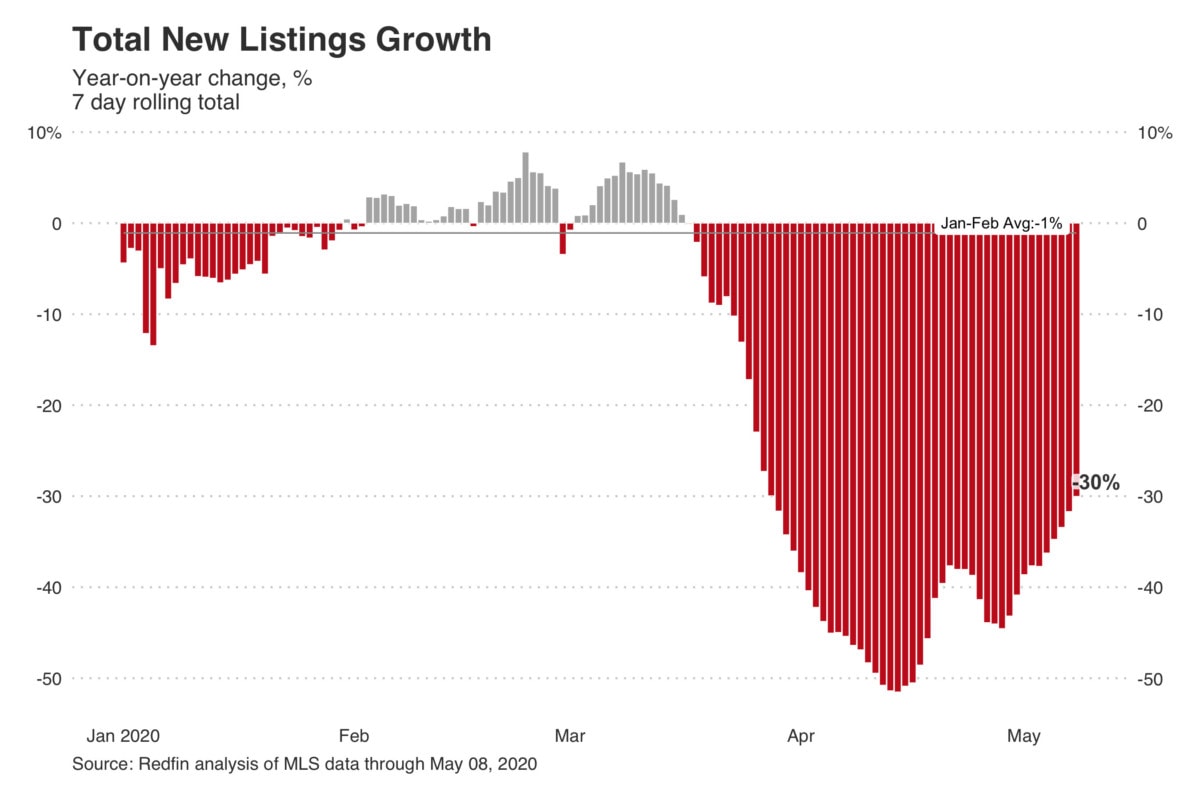
About 70,000 homes went up for sale during the week ending May 8. While that’s a 30% drop from the same period last year, it’s a substantial improvement over the 50% slide in new listings we saw in mid-April, indicating that home sellers are starting to reenter the market.
“New listings have increased every week for the past four weeks, but can’t keep up with demand,” Redfin Chief Growth Officer Adam Wiener said in his weekly market update Thursday. “Sellers who can wait are still sitting on the sidelines.”
As a result, the supply of homes—measured by the median number of active listings on the market—fell 24% year-over-year last week to about 701,000. That’s near the lowest level in the past five years.

Michigan Is Rebounding After Easing Restrictions
Michigan experienced a drastic resurgence in home listings after its governor allowed real-estate agents to resume business on May 7 following weeks of lockdown. New listings in Detroit were down just 9.8% year over year (to 2,157 homes) last week after plunging 65% only a week earlier. Similarly, new listings in Grand Rapids, MI fell just 20% (to 830 homes) following a decline of 61% the prior week.

Prices Are on the Upswing
Nationwide, listing prices are inching back up as homeowners raise their expectations for what they could reap in a sale. The median listing price climbed 5.4% year over year last week to $322,000—the highest in about two months—following a 1.7% dip in April that had brought prices to as low as about $302,000.

Demand Surpasses Pre-Pandemic Levels
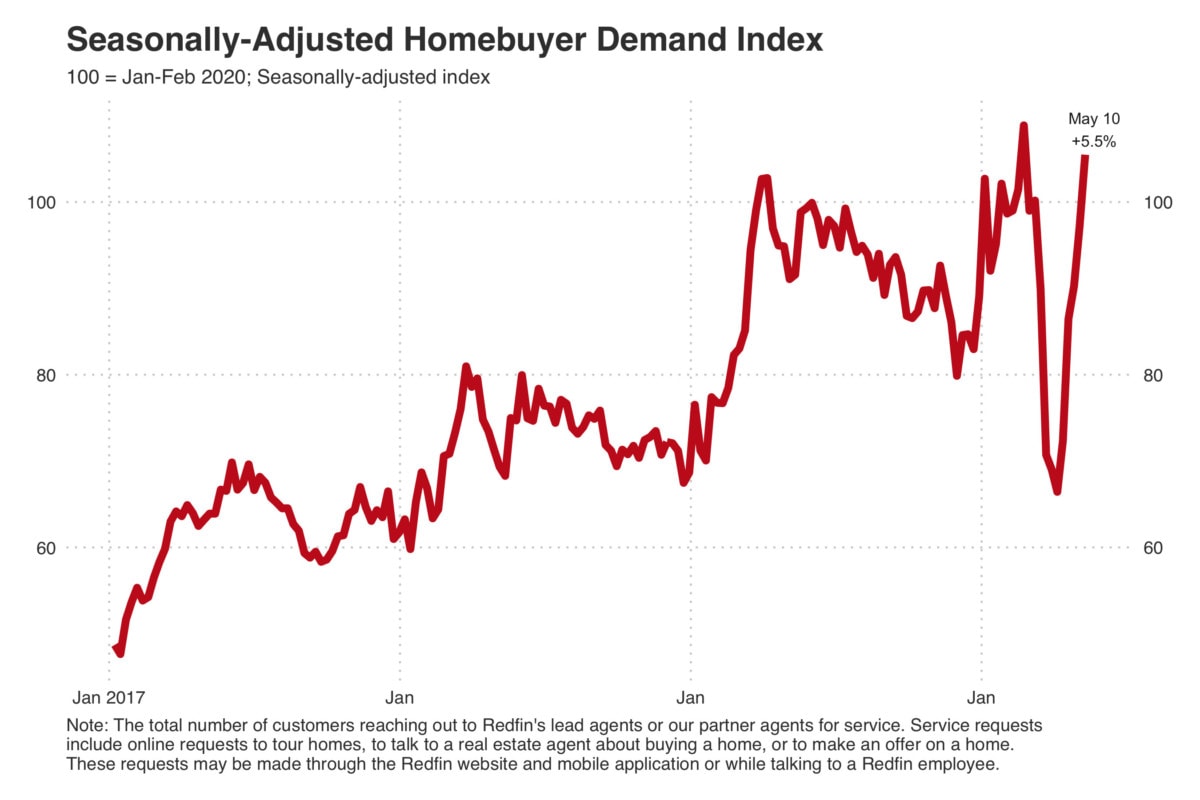
Homebuying demand is making a comeback. The measure was 5.5% higher during the week ending May 10 than it was before the pandemic on a seasonally-adjusted basis.

“The V-shaped recovery in home-buying demand is powered by record-low mortgage rates and the loosening of stay-at-home orders in some states,” Wiener said. “After two months of waiting for the other shoe to drop, buyers who are still employed may also be a little more confident about their job security.”
Homes Are Now Selling as Quickly as They Were Last Year
Since the end of March, homes had been selling at a slower pace than last year, but that’s no longer the case. During the seven-day period ending May 8, nearly 45% of the houses that went under contract did so within two weeks of being listed—the same pace we saw at this time last year, and up from 36% during the prior week. In other words, growth in the share of homes finding buyers within two weeks is now flat compared with 2019.
More People Are Applying for Mortgages
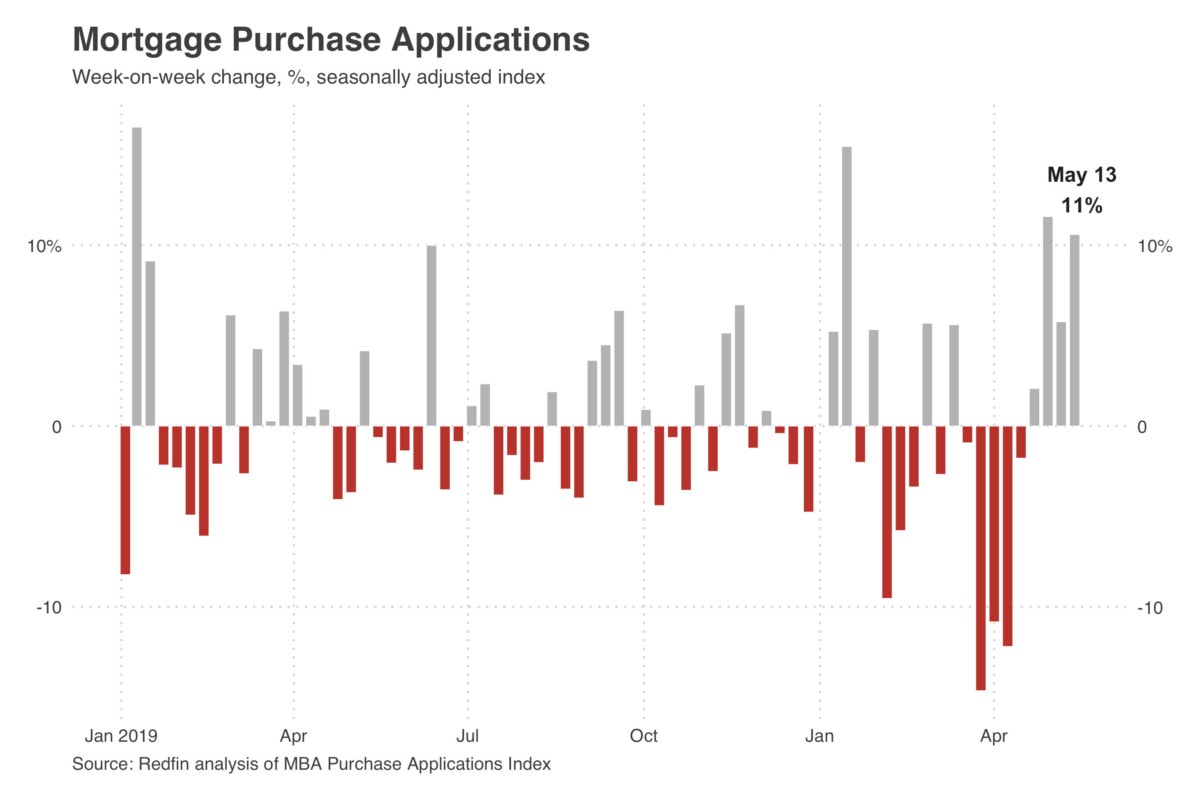
Last week, mortgage applications rose 11% from a week earlier in the fourth-consecutive period of increases as buyers reentered the market, according to the Mortgage Bankers Association.

Of the 10 biggest states in the MBA’s survey, New York led the gains with a 14% climb. Illinois, Florida, Georgia, California and North Carolina also saw double-digit increases.
The post Charting the Coronavirus Pandemic’s Latest Impact on the Housing Market appeared first on Redfin | Real Estate Tips for Home Buying, Selling & More.
